Scoring
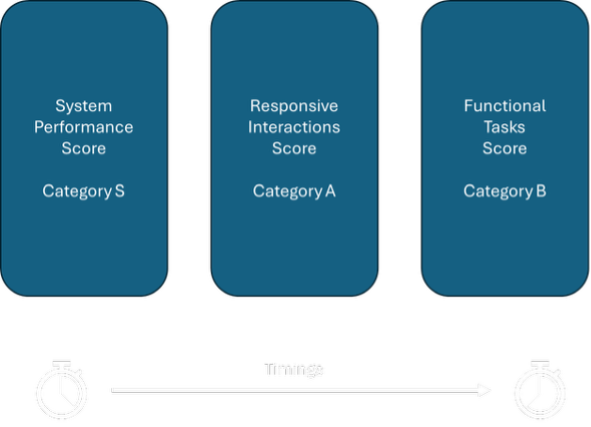
OBUX organizes tasks into three categories:
- Category S – System Performance
- Category A – Responsive Interactions
- Category B – Functional Tasks
Category S is provided as supplemental diagnostic information. Only Categories A and B contribute to the overall user score.
Category S – System Performance Scoring
Category S comprises a set of micro-benchmarks focused on CPU and disk performance, captured through application launch times. These tasks measure the environment’s underlying system performance capabilities rather than user-perceived performance.
All subtasks are equally weighted as shown in the table below. “Weight” represents the relative importance of the transaction in the score (currently all 1.0 for simplicity), and “Penalty” is a parameter related to timing thresholds. Each of these tasks is executed in 3 iterations.
| Sub-Transaction | Weight | Penalty | Iterations | Description |
|---|---|---|---|---|
| CPU high load (single core) | 1.0 | 4.0 | 3 | Intensive CPU task on one core (3× per run) |
| CPU high load (all cores) | 1.0 | 4.0 | 3 | Intensive CPU task utilizing all CPU cores |
| CPU medium load (single core) | 1.0 | 4.0 | 3 | Moderate CPU task on one core |
| CPU medium load (all cores) | 1.0 | 4.0 | 3 | Moderate CPU task on all cores |
| CPU low load (single core) | 1.0 | 4.0 | 3 | Light CPU task on one core (light background work) |
| CPU low load (all cores) | 1.0 | 4.0 | 3 | Light CPU task on all cores concurrently |
| Disk: Delete large file | 1.0 | 4.0 | 3 | Delete a large file (e.g. several hundred MB) |
| Disk: Delete small file (x3) | 1.0 | 4.0 | 3 | Delete small files (three separate small files) |
| Disk: Read large file | 1.0 | 4.0 | 3 | Read sequentially from a large file (simulate loading a big file) |
| Disk: Read small file (x3) | 1.0 | 4.0 | 3 | Read multiple small files (random I/O) |
| Disk: Write large file | 1.0 | 4.0 | 3 | Write/append to a large file |
| Disk: Write small file (x3) | 1.0 | 4.0 | 3 | Write multiple small files |
| Launch OBUX PixelGen (app start) | 1.0 | 30.0 | 3 | Time to launch the PixelGen application |
| Launch OBUX Spreadsheet (app start) | 1.0 | 30.0 | 3 | Time to launch the Spreadsheet app |
| Launch OBUX Document (app start) | 1.0 | 30.0 | 3 | Time to launch the Document app |
| Launch OBUX PDF (app start) | 1.0 | 30.0 | 3 | Time to launch the PDF reader |
| Launch OBUX Web (app start) | 1.0 | 30.0 | 3 | Time to launch the Web app interface |
| OBUX Web: Open video (90s playback) | (n/a) | (n/a) | (n/a) | Play a video for 90s – (ignored in scoring) |
Table 1: Category S (System) Sub-Transactions and Weights
Category S includes:
-
CPU tests executed at three intensity levels: high, medium, and low across both single-core and multi-core modes. This combination evaluates single-thread performance, multi-thread scaling, and behaviour under varying load levels. All CPU tasks use a penalty value of 4.0, which maps to the expected completion-time thresholds used in the scoring model.
-
Storage tasks measure file operations: read, write, and delete on both large and small files. When marked “(x3),” three separate small-file operations are performed within a single iteration. Each operation is treated as an individual measurement and contributes equally to the final score. These disk tasks also use a penalty value of 4.0.
-
Application launch times measure startup responsiveness for OBUX‑Document, OBUX‑Spreadsheet, OBUX‑PDF, OBUX‑PixelGen, and OBUX‑Web. Application launch tests use a higher penalty value of 30.0 to account for their naturally longer execution times. Launch performance is a meaningful indicator of user experience, as slow startup behaviour is often immediately perceived by end users.
The OBUX Web video tasks are included for workload completeness but are excluded from scoring. These tasks are executed but are designated on the “ignore list,” ensuring they do not affect the Category S score in the current benchmark version.
Category S - Scoring Calculation
Category S sub-transactions are measured in seconds and aggregated to produce a single composite system score. Because Category S contains heterogeneous tasks—CPU workloads, disk I/O operations, and application launches, OBUX normalizes all measurements against their respective baseline expectations, which are defined by the penalty parameters. This ensures that each measurement is interpreted consistently, regardless of its type.
All sub-transactions are equally weighted, meaning each contributes the same influence on the final Category S score. A slow result in any task, whether a CPU high-load test or an application launch, reduces the overall score by the same amount. This equal-weight approach is intentional in the current version to provide broad coverage across system characteristics. Future OBUX versions may introduce differentiated weighting if certain tasks are found to be stronger predictors of system performance or user impact.
In concept, if all Category S tasks complete faster than their expected thresholds, the composite score approaches 1.0. If tasks exceed expected times, the score decreases proportionally below 1.0.
Category A – Responsive Interactions Scoring
Category A measures short UI-level interactions, such as hovering over menu items or buttons, across the OBUX Document, Spreadsheet, and PDF applications. These actions are typically completed in milliseconds and directly influence perceived UI responsiveness. All actions use the same tight performance threshold because delays above 400ms are noticeable.
| Application | Sub-Transaction (Action) | Weight | Penalty | Iterations | Description |
|---|---|---|---|---|---|
| OBUX Document | Hover “Save As” button | 1.0 | 0.4 | 3 | Hover cursor over the Save As option (e.g. on toolbar) – measure UI response (highlight/tooltip) |
| OBUX Document | Hover Quick Access item | 1.0 | 0.4 | 3 | Hover over a Quick Access Toolbar icon (simulate checking responsiveness of ribbon UI) |
| OBUX Document | Hover “Open” menu | 1.0 | 0.4 | 3 | Hover over the Open menu item (preparing to click Open) |
| OBUX Spreadsheet | Hover “Save As” button | 1.0 | 0.4 | 3 | Hover the cursor over Save As in the spreadsheet app. |
| OBUX Spreadsheet | Hover “New” button | 1.0 | 0.4 | 3 | Hover over the New Sheet or New File button |
| OBUX Spreadsheet | Hover “Open” menu | 1.0 | 0.4 | 3 | Hover over the Open menu in the spreadsheet app. |
| OBUX PDF | Hover “Next Page” button | 1.0 | 0.4 | 3 | Hover over the Next Page arrow in the PDF viewer |
| OBUX PDF | Hover “Save As” button | 1.0 | 0.4 | 3 | Hover over the Save/Save As icon in the PDF app. |
| OBUX PDF | Hover “Open” menu | 1.0 | 0.4 | 3 | Hover over the Open file icon/menu in the PDF app. |
>Table 2: Category A (Responsive) Sub-Transactions
These interactions are labelled with an “A:” prefix in the logs (for example, “A: Hover Open”). Each represents a small UI state change, such as highlighting a button, expanding a menu, or rendering a tooltip. While these actions require minimal resources, they are highly sensitive to system load. CPU contention and graphics driver delays can introduce visible latency, even in simple hover interactions.
Each unique action is executed 3 times, once per iteration, yielding 27 total timing samples for Category A (9 actions × 3 iterations). All actions carry equal weight, so each contributes the same influence on the final Category A score. The aggregated results, using the mean and variability measures described later, form a single responsiveness metric.
On a well-optimized system, these interactions typically complete within 0.1–0.2 seconds. Systems under strain may take more than 0.5 seconds for some actions, which becomes perceptible as UI lag.
Category B – Functional Tasks Scoring
Category B measures longer-running operations, including file dialog open events, initial content rendering, and paging through multi-page documents. These actions place more load on CPU, storage, and rendering components. They represent user interactions that require waiting for visible content to load.
| Application | Sub-Transaction (Action) | Weight | Penalty | Iterations | Description |
|---|---|---|---|---|---|
| OBUX Document | Open file dialog ready | 1.0 | 4.0 | 3 | Time to open the “Open File” dialog in Document (after clicking Open) |
| OBUX Document | Page 1 found (document load) | 1.0 | 4.0 | 3 | Time for first page of document to render/display |
| OBUX Document | Page 2 found | 1.0 | 4.0 | 3 | Time to navigate to page 2 (or find text on page 2) |
| OBUX Document | Page 3 found | 1.0 | 4.0 | 3 | (Similarly page 3 navigation/search time) |
| OBUX Document | Page 4 found | 1.0 | 4.0 | 3 | Time to navigate to page 4 |
| OBUX Document | Page 5 found | 1.0 | 4.0 | 3 | Time to navigate to page 5 |
| OBUX Document | Page 6 found | 1.0 | 4.0 | 3 | Time to navigate to page 6 |
| OBUX SpreadSheet | Open file dialog ready | 1.0 | 4.0 | 3 | Time to open the file dialog in Spreadsheet app |
| OBUX SpreadSheet | Page 1 found (sheet nav) | 1.0 | 4.0 | 3 | Time to switch to or display sheet page 1 (if applicable) |
| OBUX SpreadSheet | Page 2 found | 1.0 | 4.0 | 3 | Time to navigate to page 2 (or scroll further in sheet) |
| OBUX SpreadSheet | Page 3 found | 1.0 | 4.0 | 3 | Time to navigate to page 3 |
| OBUX SpreadSheet | Page 4 found | 1.0 | 4.0 | 3 | Time to navigate to page 4 |
| OBUX PDF | Open file dialog ready | 1.0 | 4.0 | 3 | Time to open the “Open File” dialog in PDF viewer |
| OBUX PDF | Page 1 found (PDF load) | 1.0 | 4.0 | 3 | Time for first page of PDF to display after opening |
| OBUX PDF | Page 2 found | 1.0 | 4.0 | 3 | Time to navigate/display page 2 of PDF |
| OBUX PDF | Page 3 found | 1.0 | 4.0 | 3 | Time to display page 3 |
| OBUX PDF | Page 4 found | 1.0 | 4.0 | 3 | Time to display page 4 |
| OBUX PDF | Page 5 found | 1.0 | 4.0 | 3 | Time to display page 5 |
| OBUX PDF | Page 6 found | 1.0 | 4.0 | 3 | Time to display page 6 |
Table 3: Category B (Functional) Sub-Transactions
Table 3 shows a consistent structure across all applications: after an “Open” action, OBUX measures the time required for content to load and for subsequent navigation steps to complete. In OBUX-Document and OBUX-PDF, this involves loading the file and navigating through pages 1 to 6. In OBUX-SpreadSheet, the “pages” correspond to predefined navigation checkpoints within the workbook. Although the underlying applications differ, these actions all represent repeated content-navigation operations used to assess loading and rendering performance.
All Category B tasks use a penalty value of 4.0, aligning them with the expected multi-second execution range defined in the scoring model. All tasks carry equal weight. For example, OBUX-PDF generates 7 measurements per iteration (the initial dialog load plus 6 navigation steps), resulting in 21 data points across 3 iterations. Combined with Document and Spreadsheet measurements, Category B produces a large dataset, improving statistical reliability.
Category B timings are highly indicative of system capability. Well-performing environments typically open dialogs under one second and render subsequent pages in under 0.5 seconds. Systems with limited resources or higher load may exhibit multi-second delays for both dialog opening and page transitions, significantly lowering the Category B score.
Score Computation Methodology
With the task tables and their associated weights and penalty parameters defined, the next step is to convert the raw timing data into category scores. OBUX uses a statistical aggregation process followed by a normalization formula.
1. Aggregate and filter timings
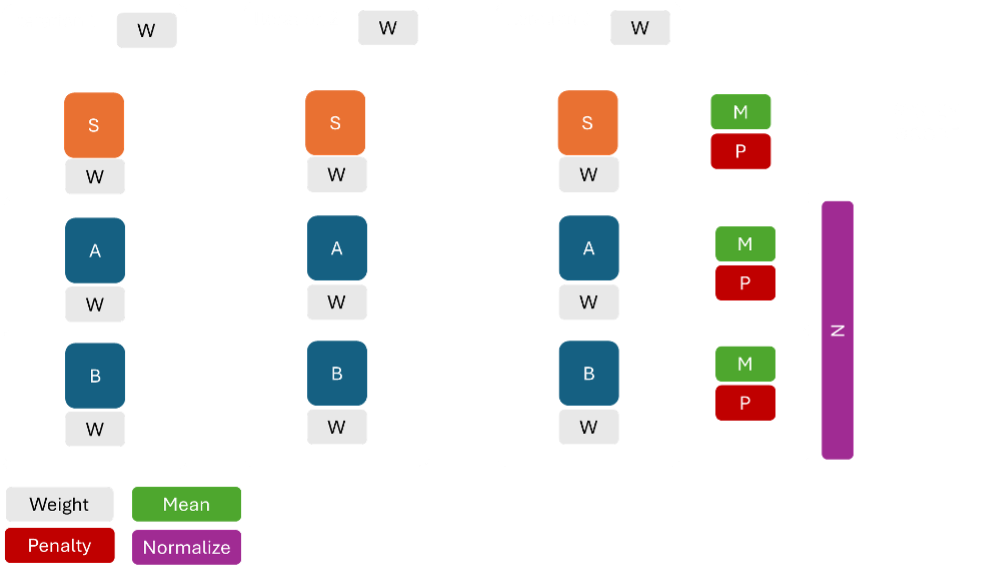
For each category (A, B), the collected timings from all iterations are aggregated. Typically, compute the mean time for each sub-transaction across iterations. However, different sub-transactions have different absolute times (opening a file might always be slower than opening a dialog). Rather than comparing raw means, OBUX uses each task’s Penalty value as a scaling factor. In practice, the algorithm does the following per category:
Calculate the mean time of all transactions in that category (essentially averaging all the measurement values together). In some implementations, they might do it per sub-transaction and then take a weighted average, but since the weights are 1, it’s effectively the average of all times in the category.
Calculate the Mean Absolute Deviation (MAD) of the times. The MAD is a measure of variability (how consistent vs erratic the timings were). It’s computed as the average of the absolute deviation of each timing from the mean. A low MAD indicates the results were stable; a high MAD indicates that some iterations were much slower than others for certain tasks.
These two metrics (\(\bar{t}\) and MAD) are combined as \(x = \bar{t} + \text{MAD}\).
The reasoning is that if there is variability, we account for it by effectively treating it as a worst-case average (mean plus deviation). If all runs were consistent, MAD is small and \(x \approx \bar{t}\). If there were occasional slowdowns, $x$ will be larger than the mean, penalizing the category for lack of consistency (because from a user’s perspective, inconsistent performance is also a negative experience).
2. Apply the scoring formula
For each category, OBUX now has a representative time value $x$ and compares this against expected baseline times for that category. The baseline expectations are encoded in two parameters:
$t$ = target time (ideal) – a threshold below which the performance is considered ideal (no penalty).
$f$ = failure time (poor) – a threshold above which the performance is considered very slow (unacceptable).
These values differ by category. For Category A (small interactions), \(t_A = 0.1\) seconds and \(f_A = 0.4\) seconds, reflecting that we expect ideal systems to handle interactions in 0.1s or less, while by 0.4s it’s getting poor. For Category B, \(t_B = 1.0\) s and \(f_B = 4.0\) s (fast systems load content ~1s; at 4s we consider it poor).
For Category S, currently many have penalty 4.0, which aligns with a similar scale (some system tasks expected around a couple of seconds), and the app launches had 30.0, which is a different scale (likely $t_S$ for those might be say ~10s and $f_S$ ~30s or something internally).
OBUX uses a normalized linear scoring formula for each category: \(\text{Score}_c = 1.0 - \frac{x_c - t_c}{2 \times (f_c - t_c)}\), where \(x_c\) is the combined time (mean+MAD) for category \(c\), \(t_c\) is the ideal threshold, and \(f_c\) is the poor threshold.
This formula produces a score that is approximately 1.0 when \(x\) is at \(t\) (or below), and about 0.5 when \(x = f\). The choice of \(2(f - t)\) in the denominator means if \(x\) equals \(2f - t\), the score would hit 0 (worst case). Essentially, performance twice as bad as the “poor” threshold yields a zero score for that category.
The formula can yield a value above 1 or below 0, but we clamp the result to 0–1. So any score >1 is set to 1 (indicating the system is beyond excellent in that category), and any score <0 is set to 0 (indicating utterly unacceptable delays).
Incorporate weights
If certain sub-transactions had more weight, the formula would incorporate a weighted average rather than a simple mean. In the current design, since weights are equal, this doesn’t change the outcome. However, the implementation multiplies the raw category score by a total weight factor and then clam the category scores are already normalized to 0–1 by the formula above he total weight of tasks in category A were, say, lower than that of B, this could ensure that both A and B are comparably scaled.
In our case, effectively, the category scores are already normalized to 0–1 by the above formula. (In pseudo-code from OBUX, they compute something akin to an intermediate “ardex” as above, multiply by total weight, then clamp, but here total weight is the count of tasks, which would push it >1 and then clamp, effectively giving the same result: 0–1.)
The key point is that each category’s score is now a number between 0 and 1 (or 0 and 100% if you prefer percentage form).
Examples
If \(x_A\) (Category A mean+MAD) was 0.2s: plugging in \(t_A = 0.1\), \(f_A = 0.4\): \(\text{Score}_A = 1 - \frac{0.2 - 0.1}{2(0.4 - 0.1)} = 1 - \frac{0.1}{0.6} = 1 - 0.1667 = 0.8333\). That would be an 83.33% score for Category A.
If \(x_B\) was 2.5s (with \(t_B = 1\), \(f_B = 4\)): \(\text{Score}_B = 1 - \frac{2.5 - 1}{2(4 - 1)} = 1 - \frac{1.5}{6} = 1 - 0.25 = 0.75\). 75% for Category B.
Overall User Experience Score
OBUX calculates the overall user experience score by averaging the Category A and Category B scores. The Category S score is excluded from this calculation, as it provides supplemental diagnostic information rather than direct user-perceived performance. The resulting overall score is then mapped to a rating using the same threshold ranges described earlier.
The overall rating provides a single summary measure of end-user experience. In many environments, Category A and B results are closely aligned for example, systems that perform poorly on heavy tasks often show reduced responsiveness in UI interactions as well. When the two scores differ significantly, the overall score (being an average) will fall in between, reflecting the mixed impact of strengths and weaknesses. For example, a system with a Good Category A score (e.g., 0.85) and a Poor Category B score (e.g., 0.60) would yield an overall score of approximately 0.73, resulting in a Fair overall rating. This indicates that although fundamental interactions feel responsive, heavier tasks noticeably degrade the user experience. A worked example follows to illustrate how timing data is transformed into scores and ratings.
Example UX Scoring Walkthrough
Imagine OBUX is executed on a particular virtual desktop configuration and produces the following representative timing results:
• Category A (Responsive Interactions): Across all the quick interactions (hovering menus, etc.), suppose the average time was \(\bar{t}_A = 0.15\) seconds, and there was a bit of variability with a mean absolute deviation \(\mathrm{MAD}_A = 0.03\) s. This yields \(x_A = 0.18\) s. This is a pretty good result (most interactions well under half a second).
• Category B (Functional Tasks): For the heavier tasks, let’s say the average time came to \($\bar{t}_B = 2.3\) seconds, and here the variability was larger, \(\mathrm{MAD}_B = 0.4\) s, because perhaps one of the iterations had a slow file open. So \(x_B = 2.7\) s.
Now, using the scoring formula:
Compute Category A score: With \(t_A = 0.1, f_A = 0.4\): \(\text{Score}_A = 1 - \frac{0.18 - 0.1}{2(0.4 - 0.1)} = 1 - \frac{0.08}{0.6} = 1 - 0.1333 = 0.8667.\)
Category A score ≈ 0.867 (or 86.7%). This would fall into the Good range (since it’s above 0.845 but below 0.935). So we’d label Category A as “Good – Responsive”.
Interpretation of Compute Category A score: The system is generally very responsive for instant interactions, with only occasional minor delays.
Compute Category B score: With \(t_B = 1.0, f_B = 4.0\): \(\text{Score}_B = 1 - \frac{2.7 - 1.0}{2(4.0 - 1.0)} = 1 - \frac{1.7}{6} = 1 - 0.2833 = 0.7167.\)
Category B score ≈ 0.717 (71.7%). Checking the rating thresholds, 0.717 is above 0.695 but below 0.845, which puts it in the Fair range. So Category B would be labeled “Fair – Functional”.
Interpretation of Compute Category B score: The system handles heavy tasks moderately; it’s neither very fast nor extremely slow, but some waits were noticeable (a few seconds here and there).
Overall Score: OBUX averages the two category scores: \((0.8667 + 0.7167) / 2 = 0.7917\) (79.2%). According to the thresholds, 0.792 is below 0.845, so the overall rating would be Fair. OBUX might present this, for example, as “Overall User Experience: Fair (0.79)”. This suggests that although quick actions were good, the slower tasks brought the overall experience down into a middle category. An IT Professional reading this might conclude: “Users will find the system generally okay to work on, but they will experience some delays during heavier operations.”
Report and Interpretation: The final output might look like:
• Responsive Interactions (Category A): 0.867 – Optimal (no significant UI lag) • Functional Tasks (Category B): 0.717 – Fair (some operations take noticeable time) • Overall User Experience: 0.79 – Fair
An IT professional can use these results to pinpoint areas for improvement. In this example, improving the overall rating from Fair to Optimal would likely mean focusing on Category B tasks. This could involve improving storage performance if file-open operations are slow, or optimizing the network when PDF content is loaded from a remote share. If Category A is the weaker area instead, the focus would shift to UI responsiveness, such as ensuring proper GPU acceleration and removing background processes that interfere with real-time interactions.
It is important to note that OBUX scoring is relative and will be refined as more data becomes available. The thresholds $t$ and $f$ are based on industry knowledge and initial testing. Still, as OBUX collects results from a broader range of environments, the community may adjust these values to reflect real-world performance distributions better. The open nature of OBUX ensures that these parameters can evolve transparently and collaboratively.
The data-processing pipeline converts raw timing measurements into meaningful results: timing data is reduced to mean and variability, passed through the scoring formula to produce normalized 0–1 scores, then mapped to descriptive ratings. Finally, the Category A and B scores are averaged to create the overall rating.
Category Ratings
Each category score (ranging from 0 to 1) is mapped to a descriptive rating:
• Optimal: Score ≥ 0.845 • Fair: Score ≥ 0.695 and < 0.845 • Poor: Score ≥ 0.495 and < 0.695 • Unacceptable: Score < 0.495
These thresholds are intentionally strict to reflect common user experience expectations. A score around 0.70 falls into the Fair range, indicating acceptable but improvable performance, whereas a score near 0.90 represents consistently strong performance. Scores below 0.50 signify noticeable degradation and typically correspond to environments where users are likely to report slowness. The cut-offs are designed to drive optimization: Ideal represents top-tier performance, Good reflects well-tuned systems, Fair aligns with typical mid-range or moderately loaded environments, and Poor or Unacceptable indicate clear performance issues that warrant investigation.